April 10 is OddThinking’s second anniversary, and time for another recap of the year.
In the 12 months, there have been a total of 110 posts (down 40% on last year), 662 comments (up 2%) and over 28,000 spams (up 990%).
Highlights by Month
April
Celebrated paper and china geek anniversaries.
Solved a couple of dilemmas that had been plaguing me, with the kind help of some commenters.
May
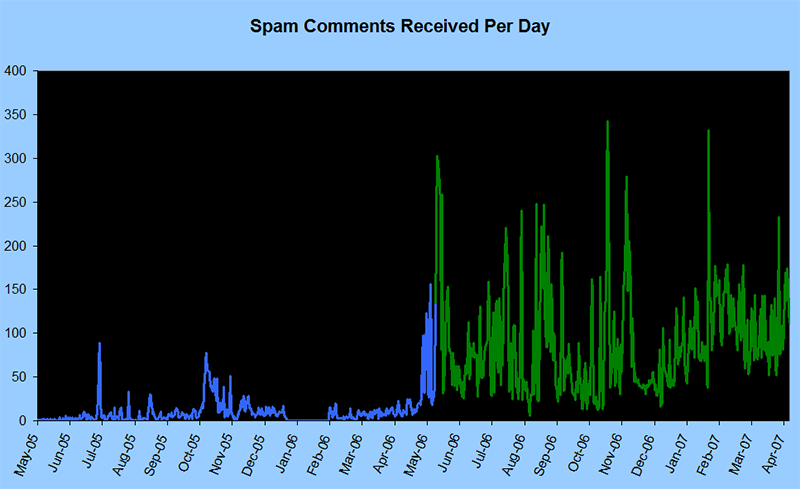
I noticed a spike in spam, and wondered “will the numbers ever drop again?” Check out the statistics below for the answer.
June
I took a second dig at Samsung.
I also worked a surprising hidden cost to some so-called free software: Google Desktop search was costing me over a dollar per quarter!
July
Quiet month.
August
Quiet month
September
Another software solution for a puzzle? Solitaire Battleships
I discovered that I used to look like Catherine Deneuve!
EmailShroud 2.0 is released.
October
I advanced social science by proving gaydar was scientifically unreliable.
November
I advanced economic science by proving free porn sites reduce spam.
December
Quiet month, due to travelling.
January
I advanced folkloric studies by revealing the truth behind Little Red Riding Hood.
I made up a puzzle to choose the best wine-gum, and it became my white whale.
February
Another quiet month, due to travelling.
March
With the help of some readers, I proved that astrology is bunk, and so is my memory. I also got a lot of help with the alpha testing of a potential new widget plugin.
April
It’s still early, but already there’s been another release of EmailShroud.
Statistics
Here are some of the statistics I pulled from this year’s logs.
Most Read Pages
- Samsung PC Studio 3 vs Microsoft Outlook
- EmailShroud
- A Kakuro Solver*
- A New Owner’s Review of the Samsung D600 Mobile Phone*
- Pursuing Sudoku with Pseudo-code*
- Browser Comparison: Password Management
- CRCRLF WordPress plugin*
- Comparing Strings: An Analysis of Diff Algorithms*
* = Originally published over a year ago, but still popular.
Most of those articles above are geeky articles. What’s popular when people aren’t in the mood for geek, and just want a story?
Most Read (Non-Geek) Stories
Overall, my geekiness factor (% posts that were rated geeky) dropped from 48% to 34%. However, I reckon even these three officially non-geeky articles are still pretty geeky, which makes me question my impartiality!
The long-term trend of geekier articles getting more interest continues: more comments continues – geeky articles get an average of 34% more comments.
Talking of comments, let’s look at the statistics there.
Most Commented Posts
- Assumption is the Mother of All Instincts – wherein the commenters feasted on my argument like piranhas.
- More Theme Changes – wherein the commenters gave me great feedback on the usability of the site.
- Samsung PC Studio 3 versus Microsoft Outlook
- Wine-gum Selection Puzzle
- Font matters
Who is making all those comments?
Most Prolific Commenters
- Me!
- Alastair from Girtby.net
- Aristotle Pagaltzis from Plasmasturm
- Sunny Kalsi from The USS Quad Damage
- Cassie
- Alan Green from Cardboard.nu
- Chris from Brainsnorkel
- Richard
- Casey Whitelaw from CaseyPorn
- Andrew
Thanks again to each of you.
Bots Statistics
Searchiest Search Engines
(i.e. whose bots crawl the most)
- Yahoo!
- MSN
- Bloglines
While not visiting me as often as Yahoo!, Google referred 50 times as many people to my site.
Search Results
A fair number of visitors come to OddThinking straight from a search engine. A record is kept of what they were looking for when they got here.
The most popular search terms change each month… slightly…
Most Popular Search Terms, by Month
| Month | Top Search Term | Runner-Up Search Term |
|---|---|---|
| Apr 06 | kakuro solver | sudoku code |
| May 06 | kakuro solver | sudoku code |
| Jun 06 | kakuro solver | samsung pc studio |
| Jul 06 | kakuro solver | samsung pc studio |
| Aug 06 | kakuro solver | samsung pc studio |
| Sep 06 | samsung pc studio | kakuro solver |
| Oct 06 | kakuro solver | samsung pc studio |
| Nov 06 | kakuro solver | samsung pc studio |
| Dec 06 | samsung pc studio | kakuro solver |
| Jan 07 | kakuro solver | samsung pc studio |
| Feb 07 | kakuro solver | samsung pc studio |
| Mar 07 | trick questions | kakuro solver |
Most Misguided Search-Engine Referrals
Last year I presented this by month. This year, I am abandoning that because there is a clear overall winner for the year: If you search Google for “where do babies come from”, this article appears on the first or second page. That’s enough for a silly number of hits every month.
Spam Levels
In May, I wondered if the recent spike in comment spam was going to be a permanent change. The answer was, of course, yes, but worse.
The chart below shows in blue the spam-levels as they were before my plaintive post in May, and, in green, the spam-levels since then.
Posting/Commenting Frequency
Here comes the big ugly graph which I find so comforting.
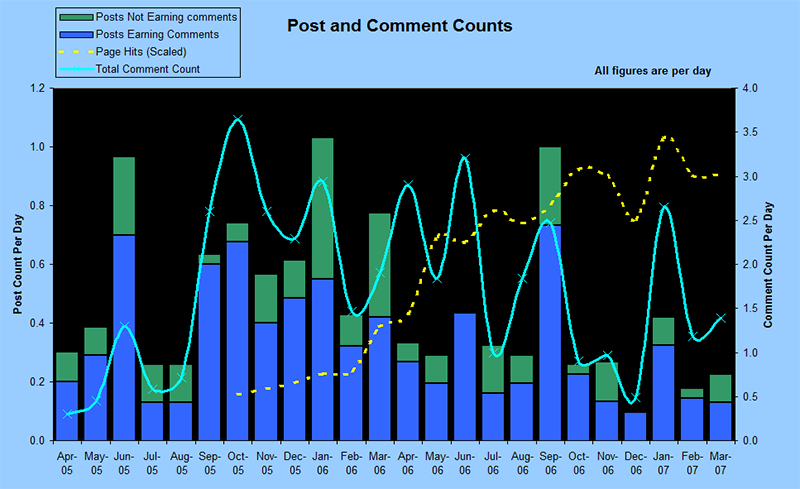
The tops of the vertical bars show how many posts I made per day. They should be measured against the scale on the left.
With the exception of September, I was less prolific this year compared to last year.
The green and blue boxes show how the posts are split between the posts that never received a response and those that did receive comments.
One metric I am trying to minimise is the percentage of green. The improvement here is only slight, but the old posts have had longer to gather comments, so I am claiming that as a small success.
The light blue line (using the scale on the right-hand axis) shows how many comments I receive per day. Unsurprisingly, it is strongly correlated to the number of posts I made. There’s definitely been a drop off in comments, in line with the drop in posts.
The dotted yellow line has no scale shown. It compares how many page hits I have had each month, since I started measuring at the end of September 05. I am quite happy with that increase!
Profits
Q: Ignoring inflation, how long before Google Adsense will pay enough money to buy my own weight in chocolate bars?
A: Inflation and the strong Australian dollar have offset some of the benefits of an increased Adsense revenue and a reduction in my own weight. Nonetheless, OddThinking has made a huge leap towards its goal, bringing the expected purchase date back from 2131 to 2056! Leave the date free for a chocolate party at my place!
Summing Up
Thanks again to all my regulars. It’s been another great year.
For the lurkers (you know who you are, even if I don’t!), don’t be afraid to make a comment, even send me a private email.
Comment by Richard on April 11, 2007
Strangely enough your email link appears to have some URL cruft left in it… Are eating your own dogfood and using EmailShroud here? This may point to a bug in the software, or at least a possibly avoidable PEBKAC.
The spam spikes are intriguing. Do they coincide with any major US holidays — or new blog postings?
Also, how’d you go about collecting and graphing those stats? I’d guess it involved the use of PyGame for Python 2.5, but maybe there’s more to it? Could that be another app added to the list above? Would that app be able to compare spam rates between two or more sites?
Comment by Julian on April 12, 2007
Richard,
Re: Broken Email Link
Thanks for identifying the PEBKAC. After a brief panic that there might indeed be a bug in EmailShroud, I inspected the original text and found I had simply failed to close off the quotes after the mailto: URL. Now fixed.
Re: Spam Spikes
Peak days in last 12 months:
I see no obvious rhyme or reason there.
The quietest days tell us less – most of them are in April last year (which just suggests the problem has grown since then.) Other quiet days are as likely to be due to local server outages as actual reduced demand.
Re: Data collection
I used some simple SQL to read the data, exported as CSV, imported into Excel, and charted from there.
Maybe this is what you are looking for: Akismet stats (via Alastair). As mentioned before, divide the spam by the ham to see spam growth rather than Aksimet growth.
Comment by Julian on April 12, 2007
Some quick value-less statistics I calculated:
I compared the daily #spam/#ham metric for Akismet and OddThinking. I tried to line up the dates, but the Akismet data format didn’t make it terribly clear. I removed a few outliers, and all days which were spam only. I looked at lines of best fit and correlation co-efficients.
Conclusions:
(a) Unsurprising, Akismet data had a lower variance than the much smaller sample of OddThinking.
(b) OddThinking’s spam growth is slightly higher than the Akismet average.
(c) There is only a slight tendency for Akismet to be hit with spam-waves on the same days as OddThinking.
(d) it is past my bedtime, and I shouldn’t do stats at this time of night.
Comment by Improfane on April 14, 2007
I check your blog pretty regularly but don’t always reply. I like both your geeky and non-geeky posts since they are interesting/insightful.
Happy Second Anniversary!